Measuring Whether Coding Agents Are Actually Working
Measure accepted outcomes, cycle time, quality, review burden, and total cost together instead of mistaking usage or code volume for value.
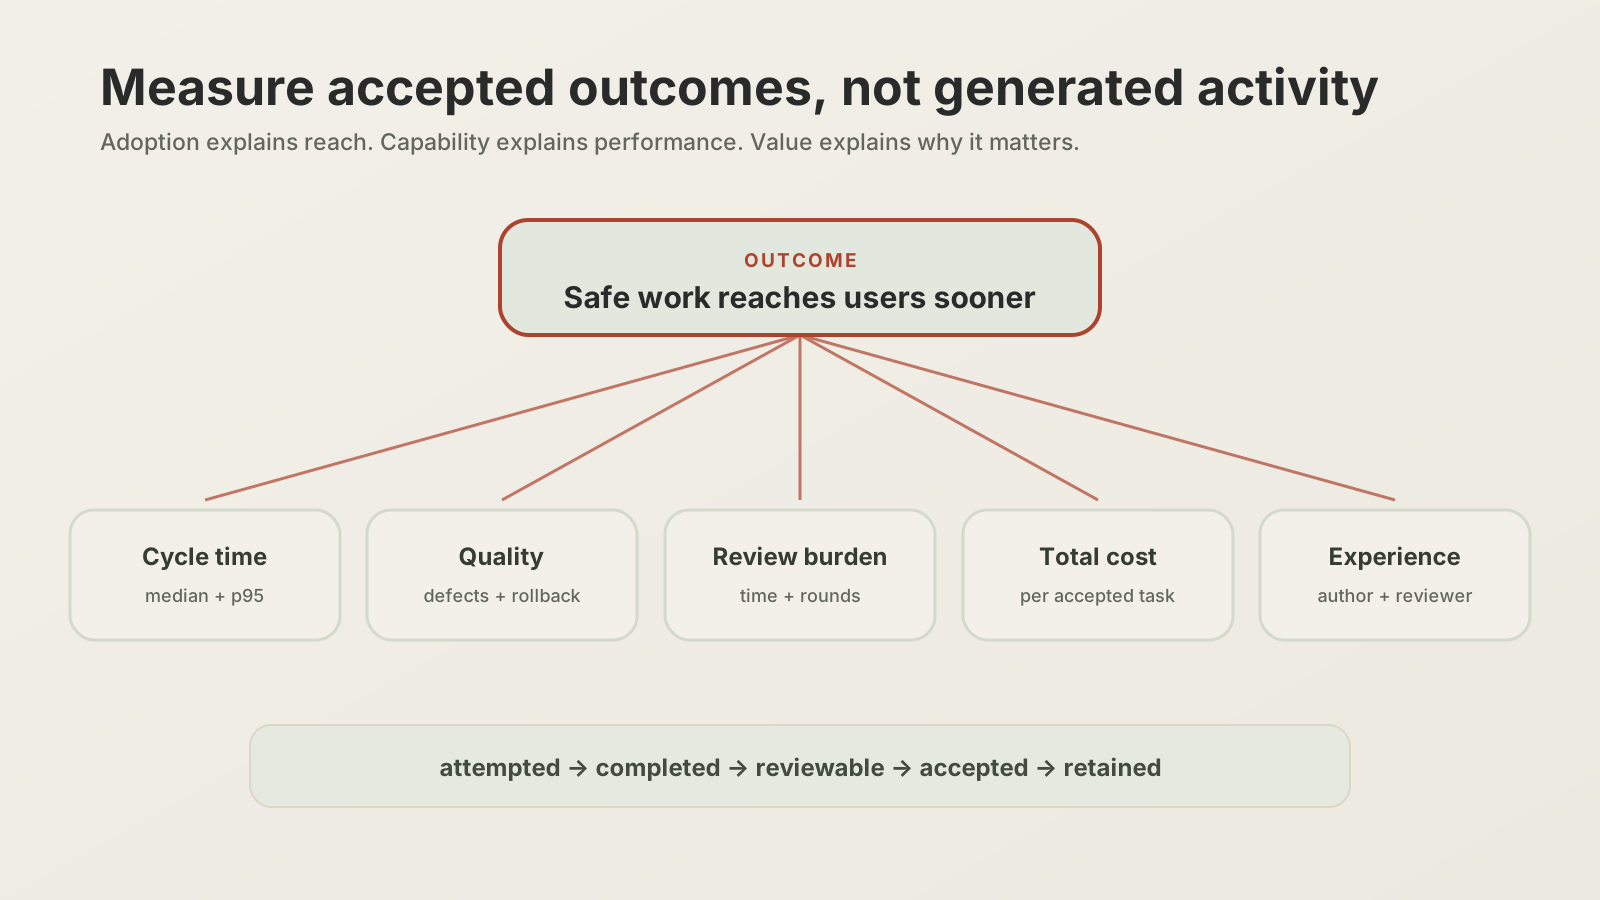
A dashboard says 78 percent of engineers used the coding agent this month.
Is that good?
It may mean the tool is valuable. It may mean the company required a trial. It may mean developers use it for autocomplete while avoiding it for work that matters. Adoption tells you that behavior occurred. It does not tell you that the behavior created value.
The unit that matters is a verified outcome someone accepted.
Measure one class of work at a time
“Engineering productivity” is too broad to evaluate as one treatment.
Choose a task class:
- dependency upgrades
- small bug fixes
- test generation
- flaky-test diagnosis
- migration planning
- documentation maintenance
- code review
Define the unit and the acceptance standard.
For dependency upgrades, one accepted unit might be:
A pull request that updates the intended dependency, contains no unrelated changes, passes the required checks, is merged, and does not cause a rollback within the observation window.
Now the comparison has a denominator. “Lines generated” does not.
Use a metric tree, not one north-star number
Connect the desired engineering outcome to signals that can explain it.
Outcome: safe upgrades land sooner
  ├─ accepted upgrades per month
  ├─ median and p95 cycle time
  ├─ reviewer time and number of review rounds
  ├─ rework, rollback, and escaped-defect rate
  ├─ total cost per accepted upgrade
  └─ developer and reviewer experience
The branches prevent easy gaming.
Cycle time can improve because reviewers absorb more work. Throughput can rise because the team accepts smaller, lower-value tasks. Defects can appear to fall because the observation window is too short.
The SPACE framework for developer productivity is useful precisely because it refuses to reduce productivity to activity. Satisfaction, performance, activity, communication, and efficiency capture different parts of the system.
Separate adoption, capability, and value
These are three different layers.
Adoption
Who uses the agent, how often, in which repositories, and for which task classes?
This identifies reach and workflow fit. Segment by role and experience; a staff engineer and a new hire may use the same tool differently.
Capability
For attempted tasks, how often does the system produce an acceptable result? How often does it require intervention, stop safely, or fail deceptively?
Track the full funnel:
attempted → completed → reviewable → accepted → retainedValue
Did accepted outcomes reduce elapsed time or hands-on effort, improve quality, reduce risk, or enable work that would otherwise not happen?
High adoption with low acceptance is a support problem. High acceptance with no workflow improvement may be a novelty. Modest adoption in one expensive maintenance workflow can still be valuable.
Count the hidden costs
Inference is only one line item.
Include:
- reviewer time
- rework and failed runs
- platform and integration engineering
- eval creation and maintenance
- security and compliance work
- training, enablement, and support
- incident response
- model and tool infrastructure
A simple economic model is:
value of accepted time saved
+ value of quality or risk improvement
+ value of additional useful work
− total workflow and change-management cost
Use ranges. The value of an hour saved is not identical across people or weeks, and “saved” time does not automatically become additional output. Sometimes it becomes deeper review, faster response, or less burnout. Those may be real benefits, but name them honestly.
Establish a credible baseline
Measure comparable work before broad rollout when possible. If the tool is already in use, use a staged cohort, matched task history, or within-team comparison.
Segment by task complexity, repository, and engineer experience. Early enthusiasts tend to select work the tool handles well; that selection bias can make the rollout look stronger than it is.
Combine telemetry with artifact review and interviews.
The data may show review time increased. A reviewer can explain why: generated changes are larger, explanations omit tradeoffs, or tests mirror the implementation instead of the requirement. That diagnosis tells you what to fix.
A worked measurement plan
For a dependency-upgrade agent, instrument these events:
task_started
agent_patch_ready
review_started
changes_requested
checks_passed
merged
reverted
Join them with task class, repository, dependency risk, model route, agent cost, and reviewer time.
Review the pilot after enough accepted tasks to see patterns. Ask:
- Which upgrades complete faster?
- Which produce more review cycles?
- Where does the agent stop safely?
- Which failures escape the workflow?
- Does the saved author time exceed added review and platform time?
- Would the team keep using this workflow if it were optional?
That last question matters. Forced adoption can create beautiful usage charts around a tool people route around.
Report the claim at the level the data supports
Do not say, “Coding agents improved engineering productivity by 30 percent” because one task class completed faster.
Say:
For routine dependency upgrades in these repositories, accepted pull requests reached merge faster, with this change in reviewer time and this observed quality profile.
That claim is narrower. It is also useful, credible, and repeatable.
The best ROI story is not how much code the agent generated. It is which verified work now reaches users faster, at what quality, and at what total cost.