How to Know When a Coding Agent Has Gone Rogue
Agent observability should connect intent, tool calls, state changes, verification, cost, and policy into one trace an operator can actually debug.
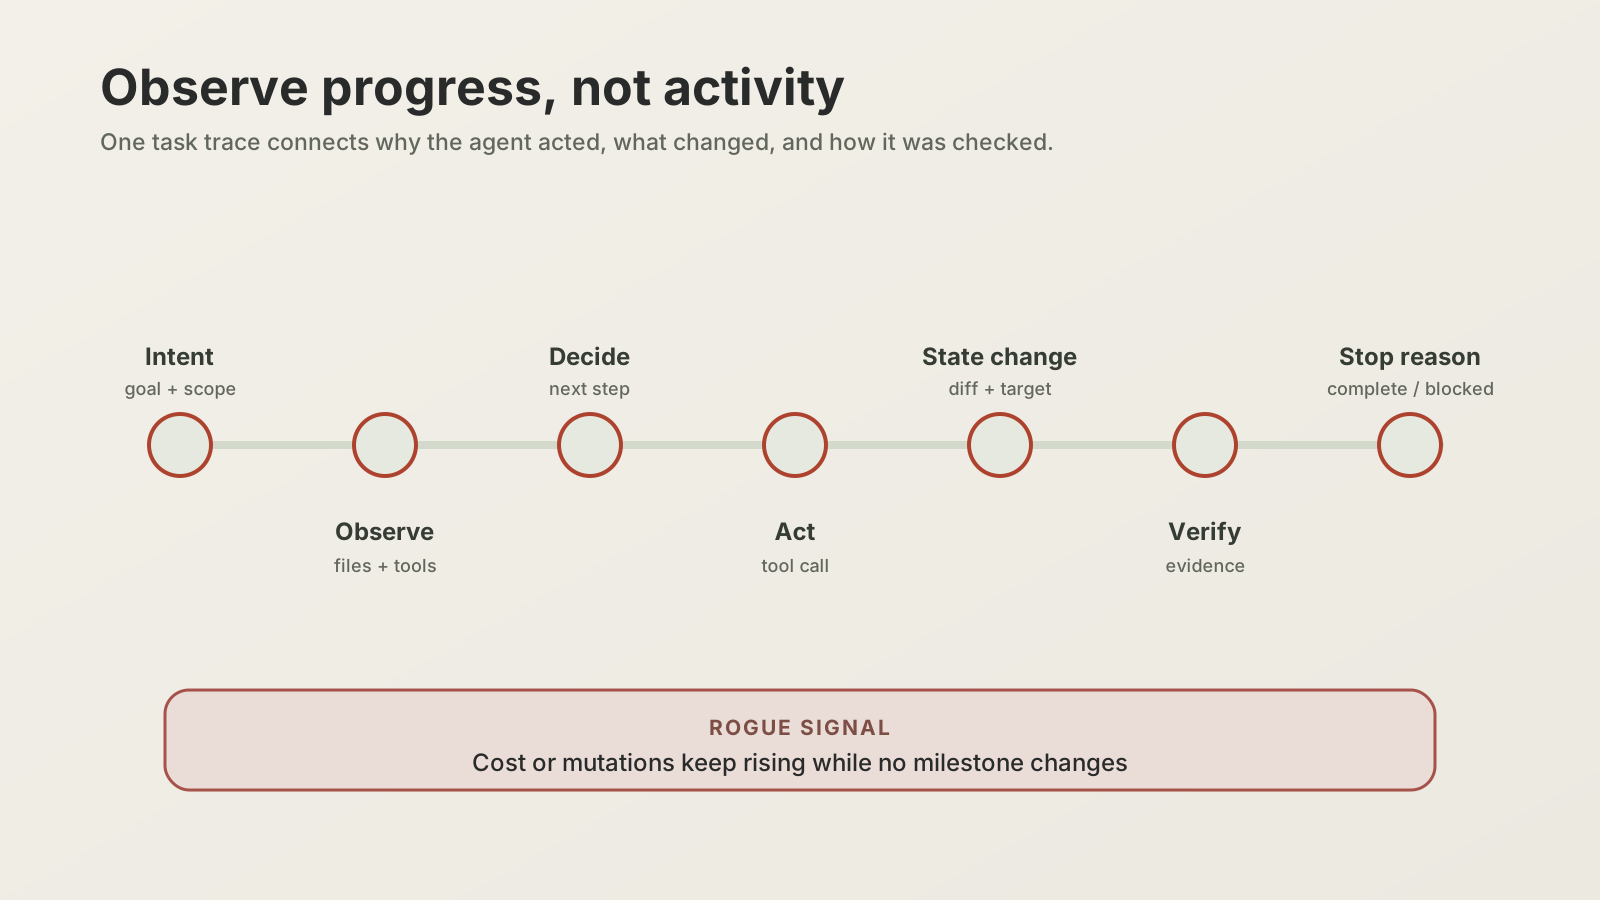
A rogue coding agent does not need to delete production.
It can make 84 tool calls, rewrite 37 files, spend most of its budget searching the wrong package, and still end with: “Implemented successfully. Tests pass.”
If your dashboard shows only tokens, latency, and HTTP errors, that run may look healthy.
Agent observability has to answer a different question: Did the system make sensible progress toward the task, within its authority, and prove the result?
Five questions every trace should answer
An operator investigating a run should not need to reconstruct it from a chat transcript, shell history, Git diff, and three provider dashboards.
The trace should answer:
- What was the agent trying to accomplish?
- What did it observe and decide?
- Which consequential actions did it take?
- What changed, and how was that change verified?
- Why did the task continue, stop, or escalate?
That creates a useful spine:
intent → observation → decision → action
→ state change → verification → next decision
Model calls are spans inside this trace. They are not the trace itself.
Instrument milestones, not private reasoning
You do not need to log hidden reasoning or every sentence the model considered. You do need the task-level decisions that explain behavior.
For each run, capture:
- task type, goal, constraints, and starting revision
- model route and configured budgets
- current workflow stage
- tools called, duration, outcome, and error class
- files, records, or services changed
- permission requests, grants, and denials
- checkpoints and retries
- verification commands and results
- final status, stop reason, and review artifact
Use one task identifier across model, tool, Git, test, and deployment events. Without correlation, an incident becomes a scavenger hunt.
The OpenTelemetry project now defines semantic conventions for generative-AI operations. Those conventions are a useful starting vocabulary for model and agent spans, but a coding workflow still needs domain events such as patch_created, scope_expanded, test_failed, and review_required.
Activity is not progress
Agents are unusually good at looking busy.
Define progress using workflow milestones:
- failure reproduced
- owning module identified
- patch created
- focused check passed
- behavior verified
- review packet ready
Then detect runs that consume time or cost without crossing a milestone.
Useful signals include:
| Signal | What it may mean | Default response |
|---|---|---|
| Same command fails three times | Retry loop without a new hypothesis | Stop or require a changed plan |
| Search radius keeps expanding | Context is wrong or task is underspecified | Re-scope the task |
| Diff grows after acceptance passes | Unrequested cleanup or drift | Freeze edits and review |
| No verification after final mutation | Evidence is stale | Mark incomplete |
| Subagent fan-out exceeds budget | Orchestration loop | Prevent new delegation |
| New network domain appears | Unexpected boundary crossing | Deny and alert |
These are not universal thresholds. Calibrate them by task class. A repository migration legitimately touches more files than a typo fix.
Make mutations first-class
The consequential moment is often not the model response. It is the state change that followed.
A file edit, dependency update, message, database write, permission change, or deployment should carry:
- the task and decision that caused it
- the acting identity
- the target and scope
- the before/after reference when practical
- the verification that followed
- reversibility or rollback information
Now an operator can answer, “Why did this file change?” without reading the entire conversation.
It also exposes a subtle failure: the agent can make a correct decision and invoke a tool that behaves incorrectly. The trace must distinguish model failure from tool failure and environment failure.
The operator view should be a timeline
The default debugging interface should compress the run:
09:02  task accepted at commit a84c
09:04  pagination failure reproduced
09:07  2 files changed
09:08  focused test passed
09:10  browser check failed: stale API fixture
09:11  task blocked; fixture owner requested
Let the operator expand prompts, command output, retrieved context, and model responses when needed. Do not make raw text the primary interface.
Join the timeline with model route, token usage, tool latency, cache hits, and cost. A slowdown may come from a more expensive model, a much larger context bundle, a flaky service, or a test command that stopped using its cache. One “agent latency” metric cannot separate them.
Observability can become a privacy leak
Prompts, source files, screenshots, tool results, and internal documents may contain secrets or personal data. A trace system that copies all of it into a broadly accessible analytics store has increased the blast radius.
Log metadata and references by default. Capture raw content only when the diagnostic value justifies it. Apply access control, redaction, retention, and deletion rules to traces as deliberately as you apply them to the source system.
This is where observability and governance meet. OpenAI’s enterprise guidance separates aggregated workspace analytics from compliance and audit records; your own platform should likewise distinguish performance measurement from investigation evidence.
Define “rogue” as a policy violation, not a personality
An agent is not rogue because its prose sounds strange. It is rogue when behavior leaves the expected envelope:
- it acts outside declared scope
- it keeps spending without progress
- it crosses a permission boundary
- it mutates state without fresh verification
- it hides failure behind a success status
- it cannot produce a reviewable account of what happened
That definition is measurable, alertable, and fixable.
The goal is not to observe every token. It is to make every consequential action explainable.